Step-Level Executions
Step-Level Executions answers: What entered and left this Step, and how did each attempt end? Start in Activity for workspace-wide monitoring or the Execution Log for one workflow’s run, then come here once you know which Step needs attention.
Finding the Executions tab
When you want to see if a step ran successfully or inspect its data payload:
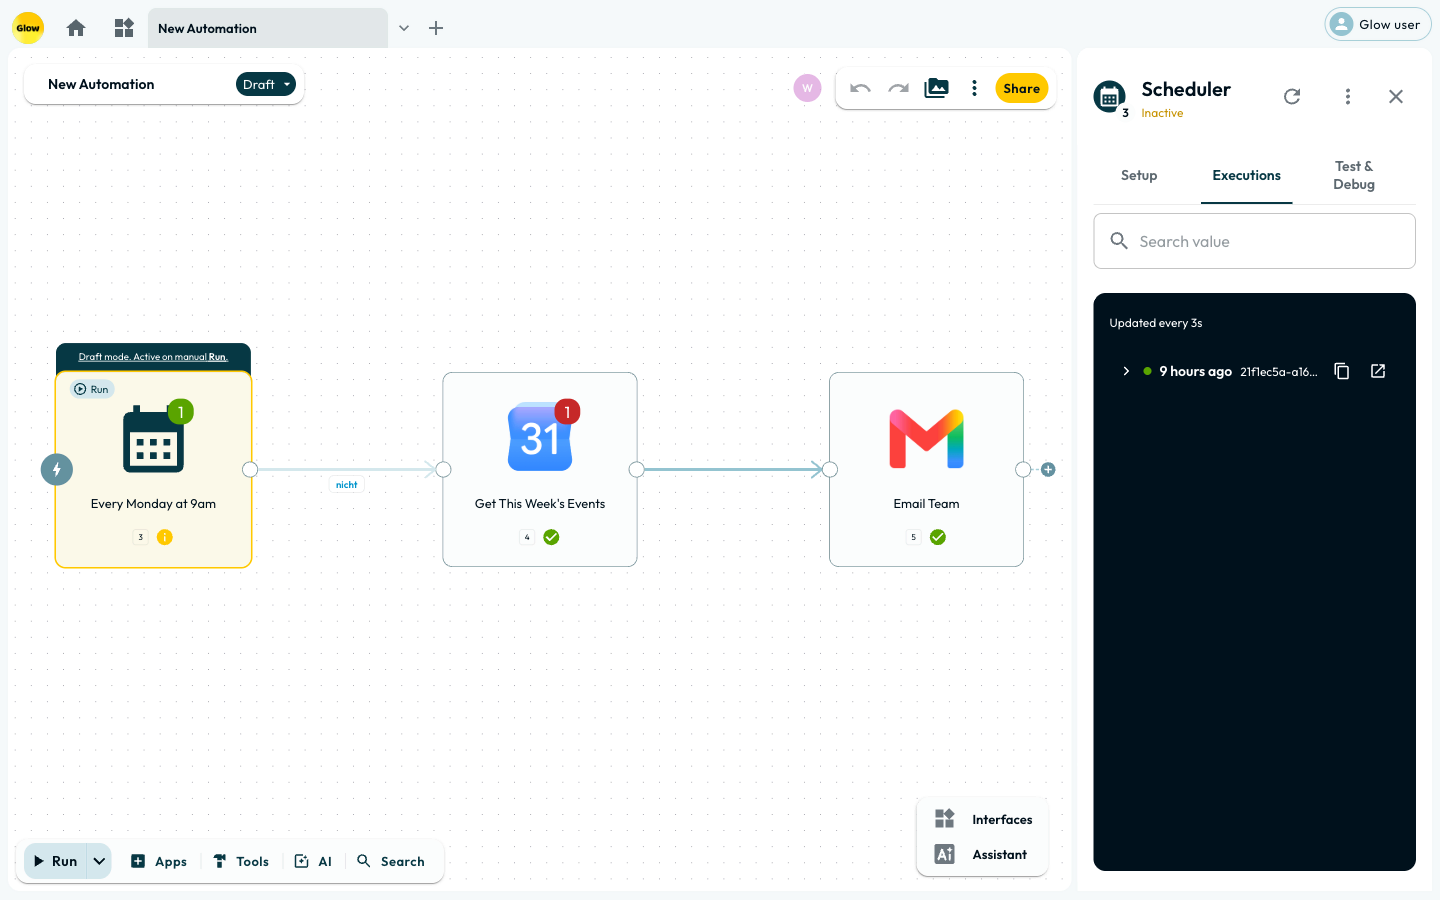
Select the Step
Click on the step directly on the canvas.
Open the App drawer
The drawer opens on the right side of the screen.
Switch to Executions
At the top of the App drawer, click the Executions tab.
Start from the whole run
If you do not yet know which Step needs attention, start in Activity. It shows the whole-run timeline across workflows and lets you open the affected workflow on the canvas.
Workflow data answers a different question: where a value came from and where it goes. Use it when a field arrives empty downstream and you need to find the connection it stopped travelling along. See Steps and Connections.
Inspecting input and output
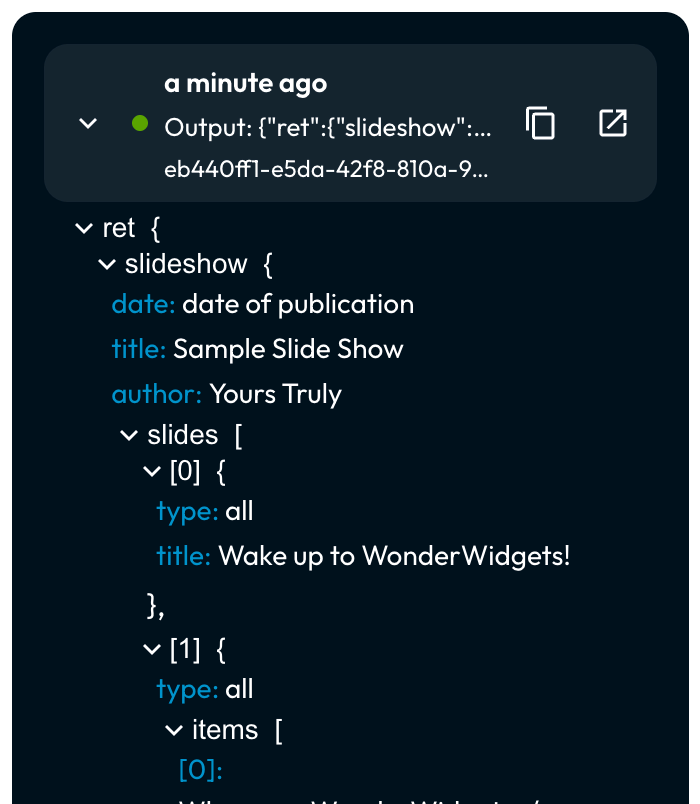
The Executions tab lists the history of every time that specific step was executed. Each entry shows a timestamp, the status (Success, Error, or Pending), the execution id, and the data the step produced. Expand an entry and the output is there as a JSON tree.
Reading multiple entries for one run
A single run can legitimately produce several entries. A step in Run for each item mode writes one per item. A step merging parallel branches writes one per incoming branch, and a loop writes one per iteration.
Entries that are genuinely retries carry an Attempt 2, Attempt 3 marker, each with its own error and timestamp. Where Glow knows how many attempts the step is allowed, the marker names the total too: Attempt 2 of 11. A first attempt is never marked, so any entry without one ran on its own. See Retry on fail for how to enable retries.
How long a run is kept
Runs are kept for 30 days after completion by default. One window covers:
- The workspace Execution log.
- Step-level records and input/output payloads.
Each run preserves the retention policy active when it executed. The Execution ID on an entry identifies the run for debugging and support requests.
Thirty days covers debugging and a monthly review, not an audit trail. If a workflow matters enough that you would want a record of it later, send what you need out of Glow while the run is happening: an HTTP Request step to your own logging, or a message to the channel your team watches. A longer window for your workspace is something to raise with your account team. See System Limits.
The output you see is the shape you reference downstream, wrapper and all.
An HTTP Request’s response arrives under ret, so what you see is
{"ret": {"id": 1}} and the reference is {{ 3.ret.id }}. Reading it once beats
guessing the path from an API’s own documentation. The Test & Debug tab shows
the same thing for a run you start by hand with test data.
To see what went into a step, look at the output of the step above it. An upstream step’s output is the downstream step’s input, so a step that failed on bad data shows its cause one step up. Where a value is built from several references, a Custom Variables step placed before it echoes the resolved value as its own output.
Live data mapping
The Executions tab is not just for debugging. It is the engine that powers the Workflow data panel.
When a step runs, Glow keeps what it produced. Open the Workflow data panel in a later step and you pick from those real values, not a bare list of field names.
Run steps early and often. Configure your trigger and hit Run to generate a real execution before you go further. As you add the steps after it, the Workflow data panel shows real values instead of a list of field names. An actual email subject line, an actual database row.
Handling errors
If a step fails, its execution entry is marked in red.
Expanding the failed execution reveals the Error Message returned by the integration or the Glow engine. It is usually the remote service’s own words:
{ "message": "Request failed with status code 404 (Not Found) - {}" }Compare that against what the step above it produced and the cause is usually obvious: a URL built from an empty variable, a field the API required and did not get. (For a list of common errors, see our Troubleshooting Guide.)
What’s Next?
- 👉 Activity →: return to the whole run and workspace alert queue.
- Error Handling & Retries: configure what happens after a Step fails.
- Troubleshooting & Common Errors: look up the symptom or exact error message.